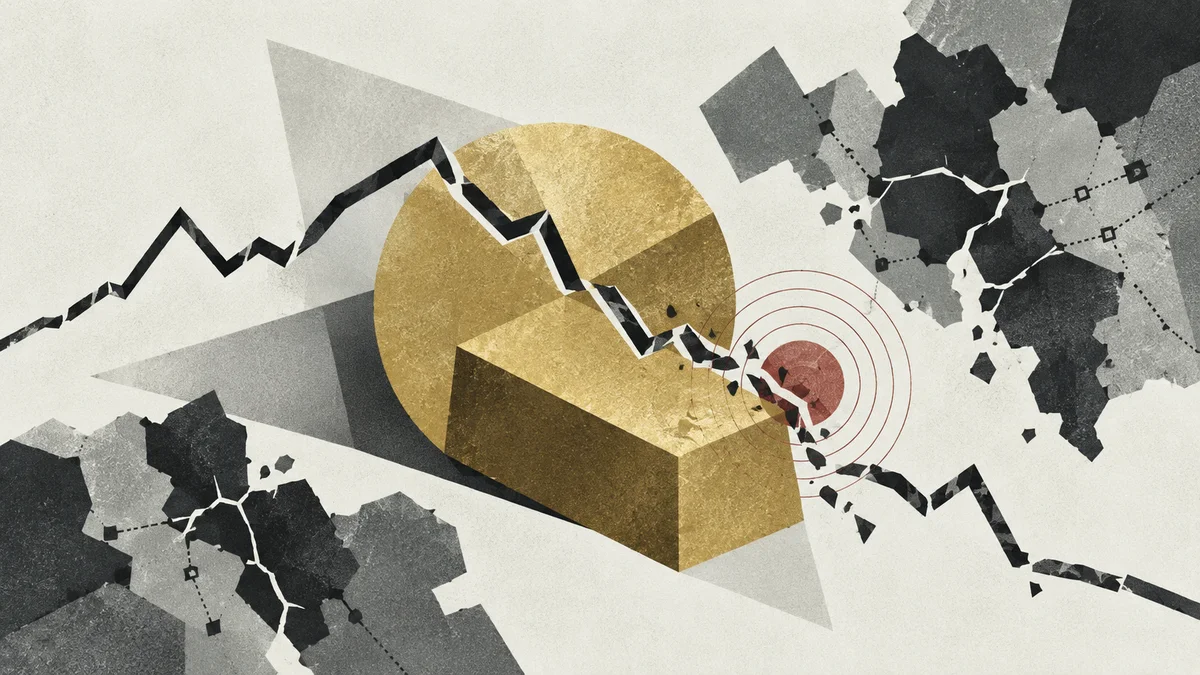
Gold entered the Iran war with two old labels attached: protection from inflation and shelter during a crisis. The labels sound as if they promise the same move. In 2026 they pulled against each other.
Build the gold chart before reading it
Open the live gold price chart and choose a window that begins before the war. A start date after 28 February hides the baseline. A one-day view captures shock. A six- or twelve-month view shows whether that shock changed a trend.
Keep the unit fixed
Gold is often quoted in US dollars per troy ounce, but a saver in another country experiences both the gold move and the exchange-rate move. Price-Chart's guide to currency and metal prices explains why the same ounce can produce different local returns.
Then preserve the raw series. The site's guide to reading historical price charts is useful here: note the interval, whether a point is a close or a live quote, and which dates are missing. A clean chart is evidence only when its labels survive the screenshot.
What gold did when the war began
Reuters reported that gold jumped when the US and Israel struck Iran, as buyers reached for assets associated with safety. Within days, the picture changed. Cash and the US dollar strengthened, oil surged and expectations of lower interest rates faded. Gold then fell with other assets.
Liquidity can come before shelter
That reversal is not proof that the safe-haven idea is empty. In a sharp funding shock, investors sell what they can sell. A liquid asset may fall because it is easy to turn into cash. Later, as the first scramble passes, demand for protection can return.
The sequence also stops a weak claim from entering the archive. The war timeline and the gold line overlap, but overlap is not causation. A useful annotation names the event and the market move, then leaves room for the dollar, bond yields, positioning and economic data.
Test the inflation story in real terms
If gold rises 8 per cent while consumer prices rise 10 per cent, its owner has lost purchasing power. Nominal charts hide that. The inflation calculator can restate an earlier money amount in current dollars, while the more targeted CPI inflation calculator makes the price-index basis explicit.
The real-return check
This is a long-horizon test. One monthly inflation release can move gold through interest-rate expectations, yet it cannot establish whether gold preserved purchasing power across a decade. The start date matters greatly. A result beginning at a price peak can say the opposite of one beginning a year earlier.
| Series | Question it answers | What it misses |
|---|---|---|
| Nominal gold | How many dollars bought an ounce | Loss of dollar purchasing power |
| CPI-adjusted gold | Whether gold beat consumer inflation | Taxes, storage and dealing costs |
| Gold in local currency | What a local saver experienced | Differences in local inflation |
Keep three dates
Record the purchase date, the sale or comparison date and the inflation index date. If they do not cover the same period, the real-return result is not comparable.
- Keep the currency unchanged.
- Use the same opening and closing dates.
- State whether fees and storage are included.
Why war and inflation pull gold both ways
War can increase demand for an asset that has no issuer and a long history as a reserve. The World Gold Council's 2026 central-bank survey found that respondents continued to cite crisis performance, long-term value and diversification. The organisation represents the gold industry, so its claims should be read with that interest in view.
At the same time, an oil shock can raise inflation and keep policy rates higher. If interest-bearing assets offer a better real return, the cost of holding non-yielding gold rises. A stronger dollar can add pressure because dollar-priced bullion becomes more expensive for buyers using other currencies.
This is how the same war can first lift gold, then push it down. Reuters described that contest in March and July 2026: safe-haven buying on one side, and the dollar, energy prices and interest-rate expectations on the other. The oil chart supplies the missing half of that account.
What the gold price chart says about this war
It says gold remained a place investors looked during danger. It also says the shelter was neither steady nor costless. The first move, the cash scramble and the later recovery belong in the same record.
It cannot say that gold rose because of one documented attack, or that a buyer acted from fear rather than a rate forecast. Those are stories a chart invites but does not prove. Market reporting can attribute views to named traders and funds; the line itself has no testimony.
Place the gold series beside the dated archive record and the slower record of war's human cost, then inflation-adjust the result. That produces a modest conclusion: gold can hedge some crisis and inflation risks over some windows, while a violent short-term shock can still make it fall. The broken pattern is the useful part.
Questions people ask about this
Does gold always rise during war?
How do I adjust a gold return for inflation?
Why did gold fall after the Iran war began?
Where this comes from
- Risk-off trade keeps gold volatile as Iran war spooks investors — Reuters
- Gold climbs as investors watch Middle East conflict — Reuters
- Central Bank Gold Reserves Survey 2026 — World Gold Council
- Second-Round Effects of Oil Prices on Inflation — Board of Governors of the Federal Reserve System
- Gold price chart — Price-Chart.com
Spotted something wrong? Tell us and we will fix it.